The monthly IBD/TIPP Economic Optimism Index, a collaboration of Investor's Business Daily and TechnoMetrica, gauges how confident consumers, workers and investors are in the pace and direction of the U.S. economy. As with all of IBD/TIPP's proprietary monthly indexes, a reading above 50 signals optimism, below 50 pessimism.
The IBD/TIPP Economic Optimism Index is made up of three subindexes, including one for the respondent's outlook six months into the future, the respondent's personal financial outlook, and how the respondent views current federal policies. The goal each month is to give as accurate a reading of the current state of the economy as possible.
Advertisement
The average for the index over nearly 16 years has been 49.2, or slightly pessimistic. The index high of 62.9 was reached in March of 2002, six months after the 9/11 attacks, as Americans rallied behind the U.S. response to the terrorist attacks and confidence grew that the post-9/11 economy would not go into recession as widely feared. The index bottomed in August 2011 at 35.8, as the economy struggled to emerge from the financial crisis and key initiatives to boost economic growth had yet to have an impact.
IBD/TIPP also produces the Presidential Leadership Index at the beginning of each month.
See the schedule of upcoming IBD/TIPP poll releases.
IBD/TIPP Economic Optimism Index: News & Analysis
IBD/TIPP Poll: Economic Optimism Slips, But Don't Blame Dow Jones Or China Trade WarThe IBD/TIPP Economic Optimism Index slipped 1.5 points to 55.1 in the past month, but remained in solidly optimistic territory at the start of August. Readings over the neutral 50 level reflect... Read MoreIBD/TIPP Economic Optimism Index: Overall
View Questions And Full Results
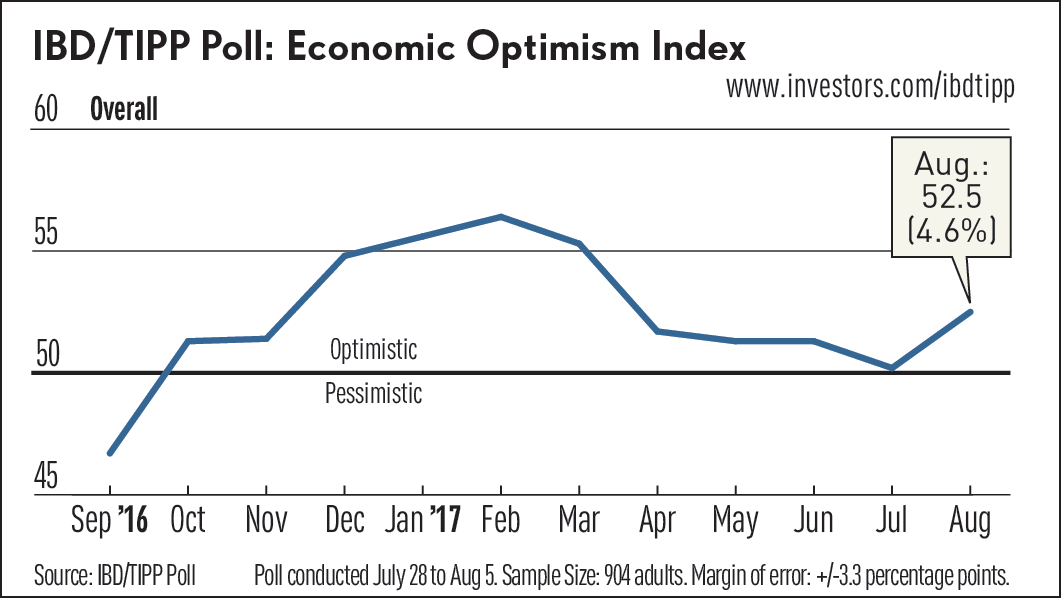
The IBD/TIPP Economic Optimism Index climbed 4.6% in August to 52.5 from July's reading of 50.2. The index reached a 10-year high of 56.4 in February. The August reading is the ninth since Donald Trump won the presidency in November and marks the 11th straight month of overall optimism on the index. The index is now nearly 3 points above its long-term average of 49.2 and nearly 8 points above the 44.4 level of December of 2007, the month that the U.S. officially entered recession.
Six-Month Economic Outlook
The Six-Month Outlook is a forward-looking gauge of how consumers feel about the economy's prospects over the next half year. The index rose 3.1% in August to 49.9. By comparison, it stood at 32.1 in December of 2007, as the economy fell into recession.
Personal Financial Outlook
The gauge of how Americans feel about their own finances in the next six months rose again in August, gaining 0.3% to reach 60.2. This is one of the most consistently optimistic indexes in the IBD/TIPP data set, and July's reading is 3.3 points above the long-term average of 56.9, but still below the high of 65.3, set in January of 2004 as the Bush-era tax cuts began.
Federal Policies
A measure of Americans' confidence in government, the Federal Policies component climbed sharply in August, up 12.1% from July to 47.3. This index briefly returned to optimistic territory in February for the first time since February 2007. Intended to give a reading on how Americans view government policies put in place by the president, Congress, the courts and the Federal Reserve, the Federal Policies Index has consistently been the least optimistic of the three subindexes that make up the Economic Optimism Index.
Main IBD/TIPP Poll Page
IBD/TIPP Presidential Approval Index
IBD/TIPP Election 2016 Tracking Poll
Past Results
July 2017
June 2017
May 2017
April 2017
March 2017
February 2017
January 2017
December 2016
Media Contact
Terry Jones
Investor's Business Daily Commentary Editor
[email protected] | 310.448.6377
Marisa Lam
GMK Communications
[email protected] | 650.232.7188